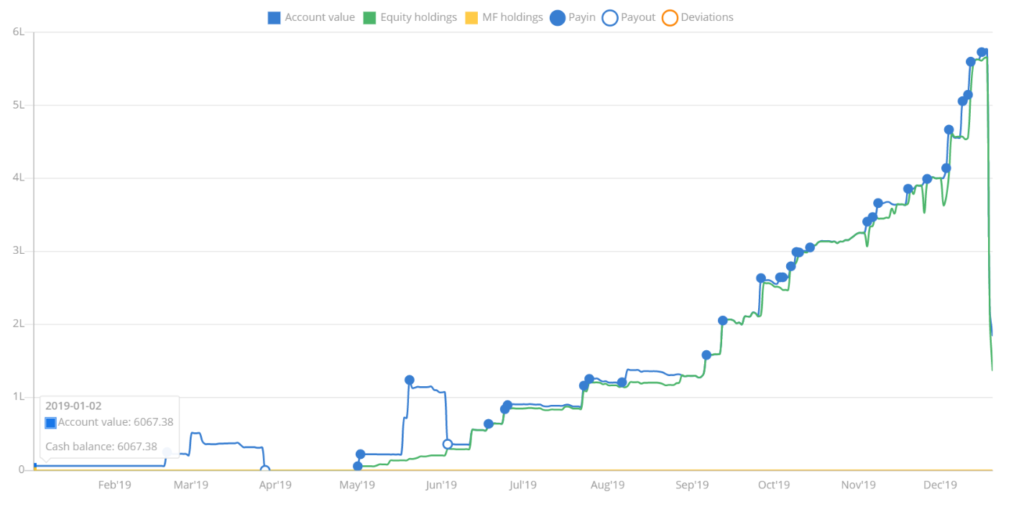
What happened here in this chart? Is it a Stock Crash? Payout? Read More

By looking at the chart, what seems in the first look that there has been a major crash. The portfolio is down by almost 70%.
As a leading institute in the field of stock market education, we provide you with the tools and knowledge to navigate the dynamic world of Nifty Bees trading. Our comprehensive courses empower you to read and analyze Nifty Bees charts, enabling you to make informed investment decisions.
Introduction to Nifty Bees Share Price Chart
In this module, we introduce you to the Nifty Bees Share Price Chart and its significance in the stock market. Gain insights into the components of the Nifty Bees Index, which represents the performance of the Nifty 50 stocks. Understand how the Nifty Bees chart provides valuable information about market trends and investor sentiment.
Analyzing Nifty Bees Chart and Graph
Learn the art of analyzing Nifty Bees charts and nifty bees graph. Discover various charting techniques and tools that help identify patterns, trends, and support/resistance levels. Develop the skills to interpret price movements, volume data, and technical indicators on the Nifty Bees chart.
Nifty Bees vs. Bank Bees
Explore the differences between Nifty Bees and Bank Bees, how to read nifty chart, two popular exchange-traded funds (ETFs) in India. Understand their respective chart patterns, share prices, and performance indicators. Compare and contrast the trends and opportunities presented by Nifty Bees and Bank Bees.
Utilizing Nifty Bees Share Price Chart for Decision-Making
Discover how to leverage the Nifty Bees Share Price Chart to make well-informed investment decisions. Learn to identify entry and exit points, set stop-loss orders, and determine profit targets based on chart patterns and technical analysis. Develop a systematic approach to trading Nifty Bees that aligns with your investment goals.
PSU Bank Bees Share Price Chart
Delve into the PSU Bank Bees Share Price Chart and explore its unique characteristics. Analyze the performance of public sector banks through this ETF and understand how to interpret the PSU Bank Bees chart to identify potential trading opportunities.
At ISM, we provide comprehensive stock market courses that cover the intricacies of reading and interpreting Nifty Bees Share Price Charts. Our experienced faculty, practical training, and cutting-edge resources ensure that you gain the necessary skills to navigate the stock market with confidence.
Now, what could possibly cause this in just one day?
This usually happens when there is a crash, payout or the holdings have been converted into cash. However, this is altogether different.
As an Individual investor or a trader, this could be shocking or if not at least a little complicated at first. Let us explain, what just happened here.
Let’s simplify now, A great proportion of the fund was allocated to nifty bees. Let’s have a look at the notes.
Note:-
i. The Below Mutual Funds Units will be Traded with new Face Value of Re.1/- w.e.f. December 19, 2019 (DR -178/2019-2020)
ii. The new ISIN number as given above shall be effective for all trades done on and from the Ex-Date i.e. December 19, 2019
Let’s understand first
What are Nifty Bees?
Nifty BeES (Benchmark Exchange Traded Scheme)—the first exchange-traded fund (ETF) in India—seeks to provide investment returns that closely correspond to the total returns of securities as represented by the S&P CNX Nifty Index. … Nifty BeES is a no-load scheme.
| SCHEME NAME CODE/ Old ISIN | RECORD DATE | PURPOSE | New ISIN |
| NIPPON INDIA ETF GOLD BEES(Scrip Code 590095)INF732E01102 | 20/12/2019 | Split of each unit of Rs.100/- to Re.1/- | INF204KB17I5 |
| NIPPON INDIA ETF NIFTY BEES(Scrip Code 590103)INF732E01011 | 20/12/2019 | Split of each unit of Rs.10/- to Re.1/- | INF204KB14I2 |
| NIPPON INDIA ETF BANK BEES (Scrip Code 590106)INF732E01078 | 20/12/2019 | Split of each unit of Rs.10/- to Re.1/- | INF204KB15I9 |
| NIPPON INDIA ETF PSU BANK BEES(Scrip Code 590108)INF732E01110 | 20/12/2019 | Split of each unit of Rs.10/- to Re.1/- | INF204KB16I7 |
| NIPPON INDIA ETF HANG SENG BEES(Scrip Code 590113)INF732E01227 | 20/12/2019 | Split of each unit of Rs.10/- to Re.1/- | INF204KB19I1 |
What is a stock split?
All publicly-traded corporations have a fixed number of stocks that are extremely good. A stock split is a decision with the aid of a company’s board of administrators to growth the variety of shares that are first rate through issuing more stocks to cutting-edge shareholders.
Why Do Stocks Split?
A stock break up is typically finished by agencies that have seen their share price boom to tiers which might be both too excessive or are past the charge tiers of similar agencies of their sector. The number one purpose is to make shares seem more affordable to small investors despite the fact that the underlying value of the enterprise has now not changed.
This has the practical effect of growing liquidity within the stock. When a stock splits, it could also bring about a share fee growth following a decrease immediately after the breakup. Since many small investors think the stock is now less costly and buy the stock, they come to be boosting demand and force up prices. Another cause for the price boom is that a stock break up gives a sign to the marketplace that the agency‘s share charge has been growing and people count on this increase will continue within the future, and again, lift call for and prices.